E Unique contexts and occurrences
We have described in Section 6.4 a “naive” definition for context, which is based on the exploration profiles and their state discretization. Let us recall that each profile has its own State-(D)SOM that is used to discretize a continuous observation vector into a discrete state identifier. The “naive” definition simply takes the list of state identifiers, i.e., the state identifier determined by each exploration profile, as the context. For example, such a context could be \([35, 23, 43, 132, 12]\), meaning that the first profile has discretized the observations as state \(35\), the second profile as \(23\), etc. However, we also mentioned that this naive method yielded too many contexts: we expand this here and detail the number of times each unique context appeared.
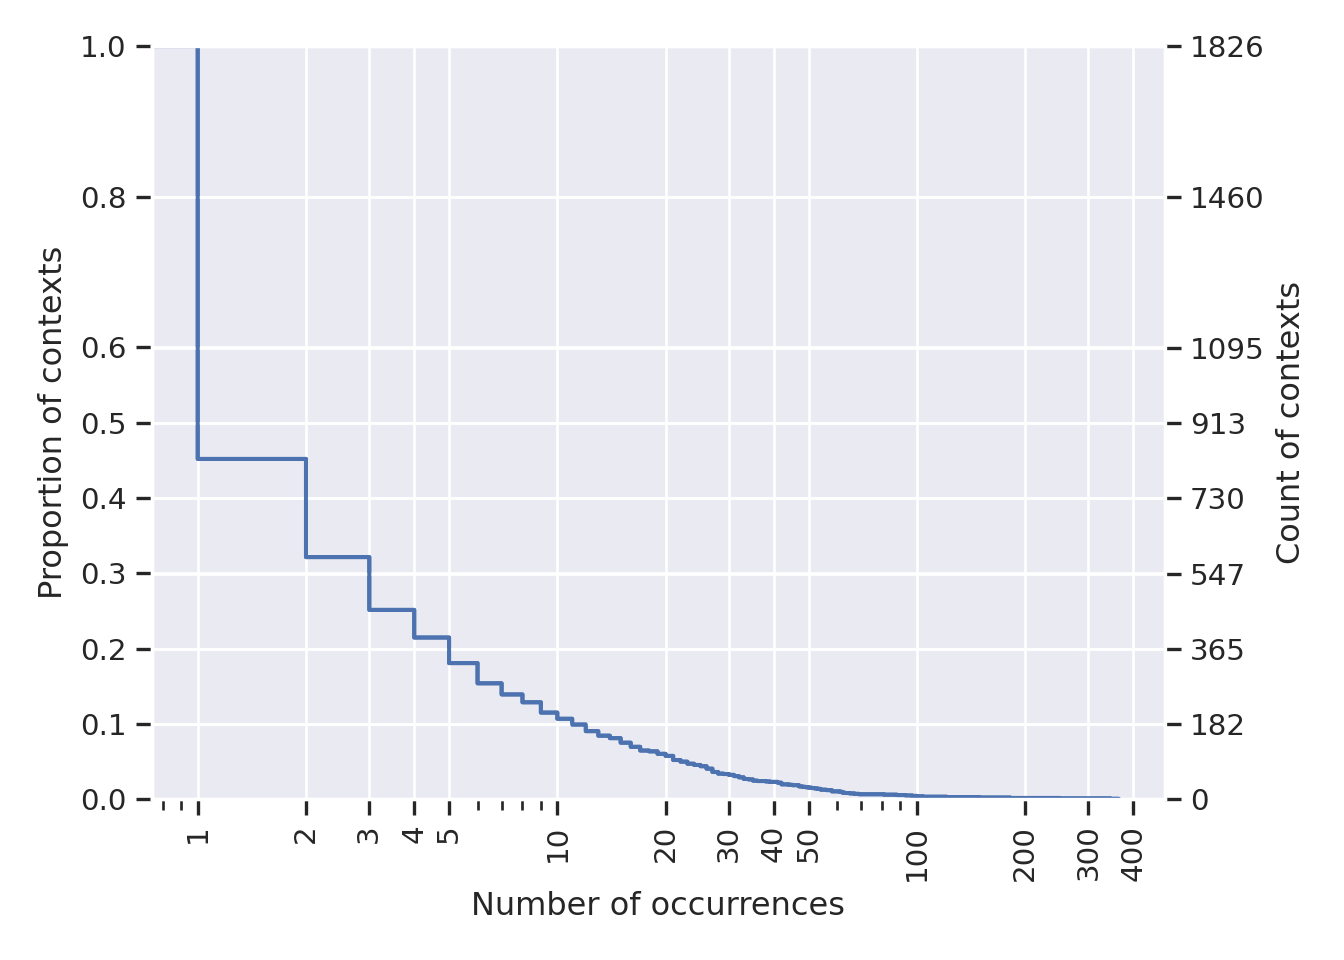
Figure E.1: Count and proportion (Y axes) of contexts appearing at least X times, using the “naive” definition, i.e., taking the list of discretized states by exploration profiles as the context.
Figure E.1 shows the proportion and count (respectively on the left-side Y axis and right-side Y axis) of contexts that appeared at last X times in the simulation. The first information we can grasp for this figure is the total number of unique contexts, which is \(1,826\). This is an improvement, when compared to the \(10,000\) time steps of the simulation, yet it is too much for a human user: it means we have to ask \(1,826\) times during the simulation. The second information is that most of the contexts appear very rarely: 55% of contexts have a single occurrence. About 30% of contexts appear more than \(3\) times, 10% appear more than \(10\) times, and so on. Although one context managed to occur about \(400\) times, the vast majority of contexts are rare. This means that the human user would spend time setting preferences, only for a small effect. The mean number of occurrences was around 5.48.
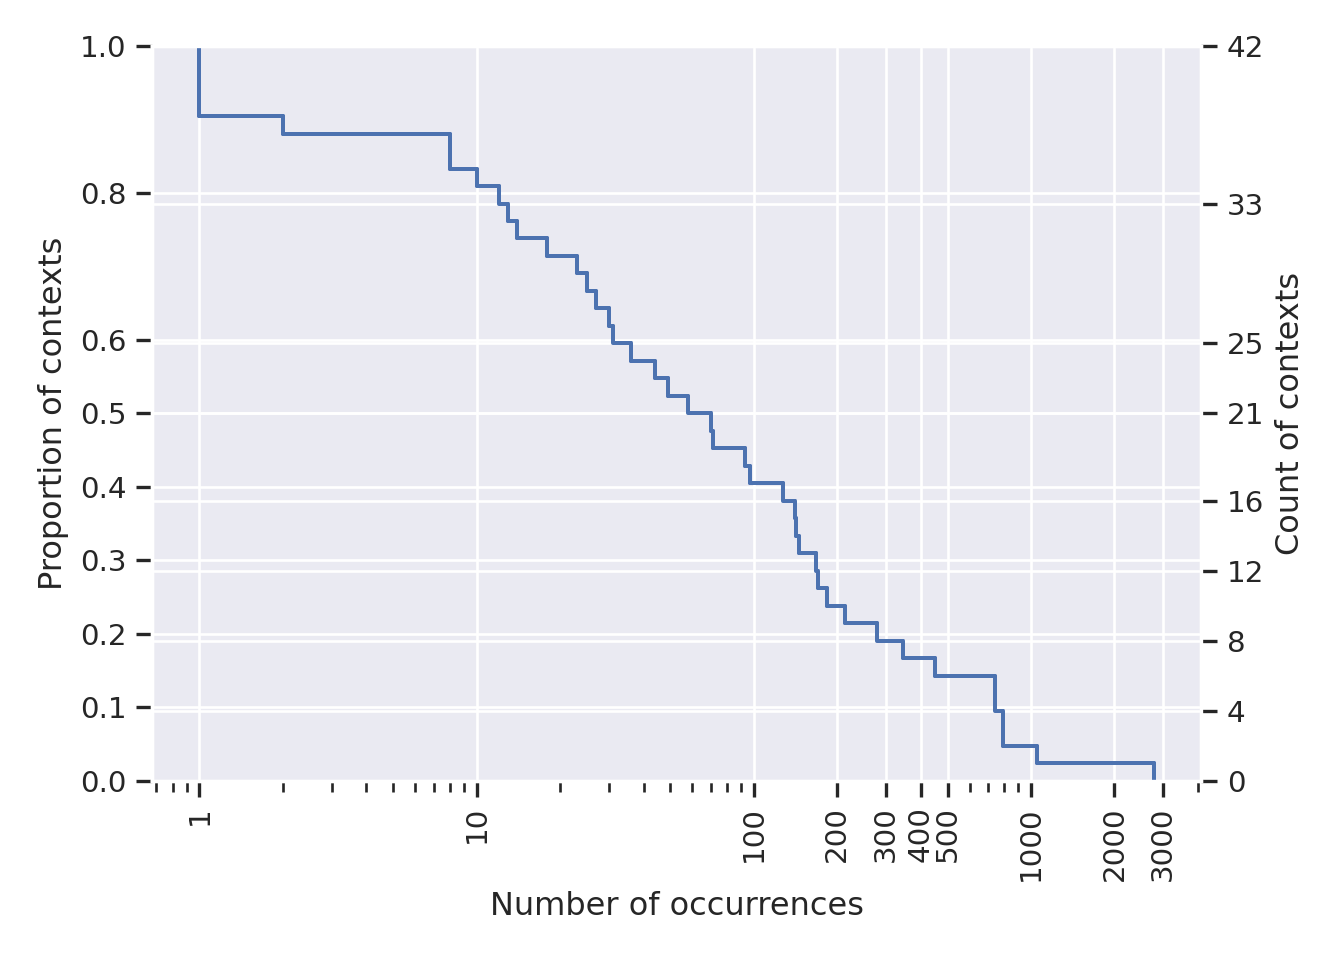
Figure E.2: Count and proportion (Y axes) of contexts appearing at least X times, using the “human” definition, i.e., asking the user to set context bounds.
On contrary, the human-based definition, which relies on the human user to define the bounds of a context when a new context is necessary, has managed to create less unique contexts. This is highlighted by Figure E.2, which shows a plot with a similar structure as the previous one. However, in this case, we have few contexts: only \(42\) unique contexts, which is a huge improvement over the \(1,826\) naive ones. Also, many contexts appeared several times: more than 80% of them appeared at least \(10\) times, about 20% appeared more than \(200\) times, and approximately 10% appeared more than \(700\) times. The mean number of occurrences, with this definition, was 238.1. This very high mean gives us another information: contrary to the previous case, where the majority of time steps were associated to various contexts that only appeared once or twice, with this new definition, the majority of steps are captured by only few contexts (less than 4) that appear thousands of times.